Wednesday, April 27, 2016

Final Project

All information/phases will be edited into this post.

Idea and planning

We want to build a biometric door lock. The lock will be unlocked by RFID and log who has access to the room and who has accessed the room. The lock will also broadcast (with the user's permission) when the user enters that way non-authorized people can enter as well. The lock will be used on a door to a shared club room that many people use, but few people have keys to. So if people want access to the room, they need to either have a key or someone already there. With this mechanism, we can extend how many people have access to the room without needing a key.

Target audience: members of our club
Solve need: yes, giving members of the club access to the room
Enhance need: yes, unlocking doors
Parts: RFID reader, strong motor to turn the lock, something for wireless communication
Libraries/Frameworks: Arduino for reading the lock/sending controls to the lock, Processing for taking lock information and logging/broadcasting
Team members:
Chaitanya Garg: senior, CS/Math major, good at software development
Giorgio Pizzorni: senior, CS/Math major, good at <whatever's on his blog post>
Division of labor: collaborate on everything

Execution and implementation

Stuff done till end of day May 4th:

RFID reader parts arrived, soldered together materials, reads an RFID card and outputs to Arduino's Serial Monitor on the computer.
Next task is to attach the servo to a spool. Spool has been created already, but hot gluing the servo and the spool failed, and so did soldering. Next attempts are crazy glue and double sided sticky tape.

Design decisions for the prototype:
Values will be hardcoded (for the time being due to the time constrant).
A demo for the registration and login page will be created (probably in Python given we both know Python).

Our demonstration will have one of our friends use the RFID lock.

Next update to be posted when we have made progress.

Stuff done till end of day May 6th:

The RFID lock actually works now! Here are a bunch of videos documenting our incremental progress throughout the day. Our code uses the Adafruit PN532 library and pretty much rips off their example code (some servo controlling is tacked on). Our next tasks are to put the RFID reader outside the door (however we don't want to do this until the presentation itself due to security/liability concerns) and to create the prototype for the registration and logging interface.


Take 1

Take 2

Take 3

Take 4

Take 5

Take 6 does not exist because numbers are hard.

Take 7

To be edited once more progress has been made.

Stuff done till end of day May 9th:

Mockup of registration and logger application has started.

Stuff done till end of day May 10th:

Created presentation. Put contraption in a box so that circuitry isn't visible. Had friend try out our reader. Finished mockup for registration and logger application.

Internals

Step by step guide

Other notes

Link to presentation (be sure to sign in with your NYU credentials):

Most of the content of the presentation should answer all questions, but here are some extra details.
  • The first RFID reader we bought just didn't work, either due to lack of a compatible library, or lack of our knowledge of how to wire it. The one that did work took us a while to figure out how to use it.
  • We ended up using Adafruit PN532 library located at https://github.com/adafruit/Adafruit-PN532 and used the sample code in the file iso14443a_uid (and built our servo controlling code on top of it).
  • Lesson learned: even if you buy a part that is advertised as no soldering required, you will need to solder something related to it sooner or later.
  • Challenge faced: on our first attempt with the contraption, the servo (the entire servo, not just the arm) moved rather than the doorknob rotating. We needed a way to keep the servo in place.
  • Lesson learned: crazy glue is really good at sticking things together.
  • Challenge faced: we had no idea how to use the RFID reader at the start.
  • Lesson learned: hardware documentation is minimal at best, non-existant at worst.
  • Lesson learned: order parts really early, delivery estimates are wrong.
  • Lesson learned: look for hardware documentation/sample code/sample usage before purchasing.
  • Change of plans: originally we wanted to have multiple RFID cards, but they didn't work. 
  • We ended up only getting 1 RFID card to actually function, the other 5 we had simply weren't being read.
  • Final thought on the project: I hope the department doesn't notice that we did this.
  • Final thought on physical computing: the idea behind the field is nice, there have been great products created, but it doesn't seem like the field for me. While I enjoyed the projects in class, I prefer programming in the more virtual sense.
Monday, April 18, 2016

Data Labs

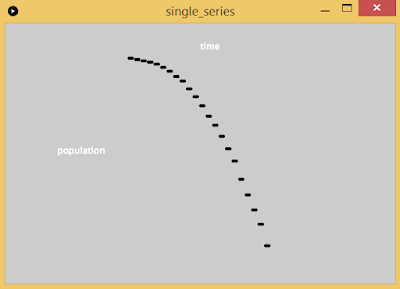
For this assignment, I decided to use as few libraries as possible just to get used to Processing without having my hand held while using it. While the data may not look visually appealing, the message is there and the visualization is still present.

Single series data

Data source: http://www.u-s-history.com/pages/h980.html
Data description: population over time
Data visualization: scatter plot
x axis is time (increase right)
y axis is population (increase down)

code (moved to IntelliJ):
package single_series;

import processing.core.*;

public class single_series extends PApplet
{
    private int[] year;
    private int[] population;

    public void settings()
    {
        size(600, 400);
    }

    public void setup()
    {
        surface.setResizable(true);
        String[] lines = loadStrings("single_series/data.txt");
        int len = lines.length;
        year = new int[len];
        population = new int[len];
        for (int i = 0; i < len; i++)
        {
            String[] split_line = lines[i].split(";");
            year[i] = Integer.parseInt(split_line[0]);
            population[i] = Integer.parseInt(split_line[1]);
            print(year[i] + " " + population[i] + "\n");
        }
    }

    public void draw()
    {
        fill(255);
        strokeWeight(4);
        textSize(14);
        text("time", 300, 40);
        text("population", 80, 200);

        for (int i = 0; i < year.length; i++)
        {
            int y = year[i] - 1600;
            int p = (population[i] / 1000000) + 50;
            line(y, p, y + 5, p);
        }
    }
}

Multiple Series data

Data sources:
https://en.wikipedia.org/wiki/Gareth_Bale#Club (red)
https://en.wikipedia.org/wiki/Lionel_Messi#Club (green)
https://en.wikipedia.org/wiki/Cristiano_Ronaldo#Club (blue)
Data description: goals (for the club) over time
Data visualization: line chart
x axis is time (increase right)
y axis is goals (increase down)

code:
package multiple_series;

import processing.core.*;

import java.util.*;

class SoccerPlayer
{
    String name;
    Map<Integer, Integer> goals;

    public SoccerPlayer(String name)
    {
        this.name = name;
        goals = new TreeMap<Integer, Integer>();
    }

    public void addGoal(int year, int num_goals)
    {
        goals.put(year, num_goals);
    }
}

/**
 * Assume we only have 3 soccer players
 */
public class multiple_series extends PApplet
{
    private List<SoccerPlayer> players;

    public void settings()
    {
        size(600, 400);
    }

    public void setup()
    {
        surface.setResizable(true);
        players = new ArrayList<SoccerPlayer>(3);
        String[] lines = loadStrings("multiple_series/data.txt");
        int i = -1;
        for (String line : lines)
        {
            if (line.indexOf("#") == 0)
            {
                // implies the line is the name of the player

                String player_name = line.substring(2, line.length());
                SoccerPlayer player = new SoccerPlayer(player_name);
                players.add(player);
                i++;
            }
            else
            {
                SoccerPlayer curr_player = players.get(i);
                if (line.length() == 0)
                    continue;
                String[] split_line = line.split(",");
                int year = Integer.parseInt(split_line[0]);
                int num_goals = Integer.parseInt(split_line[1]);
                curr_player.addGoal(year, num_goals);
            }
        }
        System.out.println();
    }

    public void draw()
    {
        fill(255);
        textSize(14);
        text("time", 200, 70);
        text("goals", 50, 150);

        for (int i = 0; i < players.size(); i++)
        {
            SoccerPlayer player = players.get(i);
            int prevx = -1;
            int prevy = -1;
            setRGB(i, 0);
            for (Map.Entry<Integer, Integer> e : player.goals.entrySet())
            {
                int year = e.getKey();
                int num_goals = e.getValue();
                int y = (year - 2000) * 10 + 100;
                int p = num_goals + 100;
                // draw line from previous point
                if (prevx != -1 && prevy != -1)
                {
                    strokeWeight(1);
                    line(prevx + 1, prevy, y, p);
                }
                strokeWeight(6);
                line(y, p, y + 1, p);
                prevx = y;
                prevy = p;
            }
        }
    }

    private void setRGB(int i, int j)
    {
        // terrible code I know
        switch (i)
        {
            case 0:
                stroke(255 - j, 0, 0);
                break;
            case 1:
                stroke(0, 255 - j, 0);
                break;
            case 2:
                stroke(0, 0, 255 - j);
                break;
            default:
                break;
        }
    }
}


Real time data

Data source: https://www.wunderground.com/US/NY/New_York.html
Data description: temperature over time
Data visualization: scatter plot

x axis is time (increase right)
y axis is temperature, degrees F, (increases up)

Details:
the first picture is about 15 seconds after program start
the second picture is about 45 seconds after program start
every second, the program makes a web request to the web server, and parses out the temperature and last updated offset areas of the page, and graphs them
time is determined by current time minus last updated offset minus program start time
the reason for the weird gaps that don't seem uniform is just how long it takes the website to display a new reading

a library called jsoup was used to make requesting and parsing HTML simple
originally I planned on using the HTTP library on Processing's website, but that did not have parsing capabilities (at least not at first glance)
I decided against using a graphical library as the statement at the start of the post, but used an HTTP/HTML library as that's not Processing-only (or at least under the domain of Processing)

code:
package real_time;

import java.io.*;

import org.jsoup.*;
import org.jsoup.nodes.*;
import org.jsoup.select.*;
import processing.core.*;

class WeatherInfo
{
    private long seconds_displacement;
    private double temperature;

    WeatherInfo(long time_displacement, double temperature)
    {
        this.seconds_displacement = time_displacement;
        this.temperature = temperature;
    }

    long get_seconds_displacement()
    {
        return seconds_displacement;
    }

    double get_temperature()
    {
        return temperature;
    }
}

public class real_time extends PApplet
{
    // considered the "0" time
    private long start_time;

    public void settings()
    {
        size(600, 400);
    }

    private WeatherInfo connectToSite()
    {
        Document weather_doc = null;
        try
        {
            weather_doc = Jsoup.connect("https://www.wunderground.com/US/NY/New_York.html").get();
        }
        catch (IOException e)
        {
            e.printStackTrace();
            System.err.println("Unable to connect to weather website, exiting");
            System.exit(1);
        }
        Elements weather_info = weather_doc.select("#curTemp span");
        String weather_str = weather_info.get(1).text();
        Elements updated_info = weather_doc.select("#update-time");
        String updated_str = updated_info.get(0).text();
        double temperature = Double.parseDouble(weather_str);
        if (!updated_str.contains("second"))
        {
            System.out.println(updated_str);
            System.err.println("Unable to parse time displacement");
            return null;
        }
        long curr_time = System.currentTimeMillis();
        long weather_time = Long.parseLong(updated_str.substring(0, updated_str.indexOf(" ")));
        curr_time -= 1000 * weather_time;
        return new WeatherInfo((curr_time - start_time) / 1000, temperature);
    }

    public void setup()
    {
        surface.setResizable(true);
        // give ourselves 1 minute headroom in case weather info is old
        start_time = System.currentTimeMillis() - 60000;
    }

    public void draw()
    {
        fill(255);
        textSize(14);
        text("time", 200, 30);
        text("temperature", 30, 70);
        WeatherInfo w = connectToSite();
        if (w == null)
        {
            return;
        }
        try
        {
            Thread.sleep(1000);
        }
        catch (InterruptedException e)
        {
            e.printStackTrace();
        }
        strokeWeight(4);
        long time = w.get_seconds_displacement();
        float temp = (float)w.get_temperature();
        line(time + 100, 200 - temp, time + 101, 200 - temp);
        System.out.println("Drawing: " + time + ", " + temp);
    }
}

Saturday, April 9, 2016

Motor Labs

Control servo via Processing

(no questions)

Control DC motor via potentiometer

Here's the code used:
const int pot_pin = A0;
const int motor_pin = 9;

void setup()
{
  // put your setup code here, to run once:
  pinMode(pot_pin, INPUT);
  pinMode(motor_pin, OUTPUT);
  Serial.begin(9600);
}

void loop()
{
  // put your main code here, to run repeatedly:
  int motor_speed = map(pot_read(), 0, 1023, 0, 255);
  int time = 500;
  analogWrite(motor_pin, motor_speed);
  delay(time);
}

int pot_read()
{
  int pot_val = analogRead(pot_pin);
  Serial.println("Potentiometer read: " + (String)pot_val);
  return pot_val;
}

Control DC motor via Processing

Here's the code used:
const int motor_pin = 9;

void setup()
{
  // put your setup code here, to run once:
  pinMode(motor_pin, OUTPUT);
  Serial.begin(9600);
}

void loop(){
  // put your main code here, to run repeatedly:
  if (Serial.available() > 0)
  {
    int read_in = Serial.read();
    int motor_speed = map(read_in, 0, 255, 0, 255);
    int time = 100;
    analogWrite(motor_pin, motor_speed);
  }
  delay(10);
}

and

import processing.serial.*;

Serial arduinoPort;

void setup(){
  size(320, 240);
  background(0,255,255);
  println(Serial.list());
  
  String portName = Serial.list()[0];
  arduinoPort = new Serial(this, portName, 9600);
}

void draw() {
  int servoVal = (int) 255 * mouseX / width;
  arduinoPort.write(servoVal);
  println(servoVal);
  
  background(255,255,0);
  fill(255,0,0);
  ellipse(mouseX, mouseY, 50, 50);
}