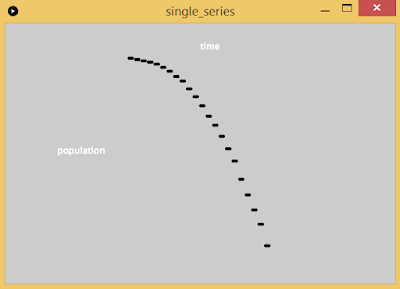
Single series data
Data source: http://www.u-s-history.com/pages/h980.htmlData description: population over time
Data visualization: scatter plot
x axis is time (increase right)
y axis is population (increase down)
code (moved to IntelliJ):
package single_series;
import processing.core.*;
public class single_series extends PApplet
{
private int[] year;
private int[] population;
public void settings()
{
size(600, 400);
}
public void setup()
{
surface.setResizable(true);
String[] lines = loadStrings("single_series/data.txt");
int len = lines.length;
year = new int[len];
population = new int[len];
for (int i = 0; i < len; i++)
{
String[] split_line = lines[i].split(";");
year[i] = Integer.parseInt(split_line[0]);
population[i] = Integer.parseInt(split_line[1]);
print(year[i] + " " + population[i] + "\n");
}
}
public void draw()
{
fill(255);
strokeWeight(4);
textSize(14);
text("time", 300, 40);
text("population", 80, 200);
for (int i = 0; i < year.length; i++)
{
int y = year[i] - 1600;
int p = (population[i] / 1000000) + 50;
line(y, p, y + 5, p);
}
}
}
Multiple Series data
Data sources:https://en.wikipedia.org/wiki/Gareth_Bale#Club (red)
https://en.wikipedia.org/wiki/Lionel_Messi#Club (green)
https://en.wikipedia.org/wiki/Cristiano_Ronaldo#Club (blue)
Data description: goals (for the club) over time
Data visualization: line chart
x axis is time (increase right)
y axis is goals (increase down)
code:
package multiple_series;
import processing.core.*;
import java.util.*;
class SoccerPlayer
{
String name;
Map<Integer, Integer> goals;
public SoccerPlayer(String name)
{
this.name = name;
goals = new TreeMap<Integer, Integer>();
}
public void addGoal(int year, int num_goals)
{
goals.put(year, num_goals);
}
}
/**
* Assume we only have 3 soccer players
*/
public class multiple_series extends PApplet
{
private List<SoccerPlayer> players;
public void settings()
{
size(600, 400);
}
public void setup()
{
surface.setResizable(true);
players = new ArrayList<SoccerPlayer>(3);
String[] lines = loadStrings("multiple_series/data.txt");
int i = -1;
for (String line : lines)
{
if (line.indexOf("#") == 0)
{
// implies the line is the name of the player
String player_name = line.substring(2, line.length());
SoccerPlayer player = new SoccerPlayer(player_name);
players.add(player);
i++;
}
else
{
SoccerPlayer curr_player = players.get(i);
if (line.length() == 0)
continue;
String[] split_line = line.split(",");
int year = Integer.parseInt(split_line[0]);
int num_goals = Integer.parseInt(split_line[1]);
curr_player.addGoal(year, num_goals);
}
}
System.out.println();
}
public void draw()
{
fill(255);
textSize(14);
text("time", 200, 70);
text("goals", 50, 150);
for (int i = 0; i < players.size(); i++)
{
SoccerPlayer player = players.get(i);
int prevx = -1;
int prevy = -1;
setRGB(i, 0);
for (Map.Entry<Integer, Integer> e : player.goals.entrySet())
{
int year = e.getKey();
int num_goals = e.getValue();
int y = (year - 2000) * 10 + 100;
int p = num_goals + 100;
// draw line from previous point
if (prevx != -1 && prevy != -1)
{
strokeWeight(1);
line(prevx + 1, prevy, y, p);
}
strokeWeight(6);
line(y, p, y + 1, p);
prevx = y;
prevy = p;
}
}
}
private void setRGB(int i, int j)
{
// terrible code I know
switch (i)
{
case 0:
stroke(255 - j, 0, 0);
break;
case 1:
stroke(0, 255 - j, 0);
break;
case 2:
stroke(0, 0, 255 - j);
break;
default:
break;
}
}
}
Real time data
Data source: https://www.wunderground.com/US/NY/New_York.htmlData description: temperature over time
Data visualization: scatter plot
y axis is temperature, degrees F, (increases up)
Details:
the first picture is about 15 seconds after program start
the second picture is about 45 seconds after program start
every second, the program makes a web request to the web server, and parses out the temperature and last updated offset areas of the page, and graphs them
time is determined by current time minus last updated offset minus program start time
the reason for the weird gaps that don't seem uniform is just how long it takes the website to display a new reading
a library called jsoup was used to make requesting and parsing HTML simple
originally I planned on using the HTTP library on Processing's website, but that did not have parsing capabilities (at least not at first glance)
I decided against using a graphical library as the statement at the start of the post, but used an HTTP/HTML library as that's not Processing-only (or at least under the domain of Processing)
code:
package real_time;
import java.io.*;
import org.jsoup.*;
import org.jsoup.nodes.*;
import org.jsoup.select.*;
import processing.core.*;
class WeatherInfo
{
private long seconds_displacement;
private double temperature;
WeatherInfo(long time_displacement, double temperature)
{
this.seconds_displacement = time_displacement;
this.temperature = temperature;
}
long get_seconds_displacement()
{
return seconds_displacement;
}
double get_temperature()
{
return temperature;
}
}
public class real_time extends PApplet
{
// considered the "0" time
private long start_time;
public void settings()
{
size(600, 400);
}
private WeatherInfo connectToSite()
{
Document weather_doc = null;
try
{
weather_doc = Jsoup.connect("https://www.wunderground.com/US/NY/New_York.html").get();
}
catch (IOException e)
{
e.printStackTrace();
System.err.println("Unable to connect to weather website, exiting");
System.exit(1);
}
Elements weather_info = weather_doc.select("#curTemp span");
String weather_str = weather_info.get(1).text();
Elements updated_info = weather_doc.select("#update-time");
String updated_str = updated_info.get(0).text();
double temperature = Double.parseDouble(weather_str);
if (!updated_str.contains("second"))
{
System.out.println(updated_str);
System.err.println("Unable to parse time displacement");
return null;
}
long curr_time = System.currentTimeMillis();
long weather_time = Long.parseLong(updated_str.substring(0, updated_str.indexOf(" ")));
curr_time -= 1000 * weather_time;
return new WeatherInfo((curr_time - start_time) / 1000, temperature);
}
public void setup()
{
surface.setResizable(true);
// give ourselves 1 minute headroom in case weather info is old
start_time = System.currentTimeMillis() - 60000;
}
public void draw()
{
fill(255);
textSize(14);
text("time", 200, 30);
text("temperature", 30, 70);
WeatherInfo w = connectToSite();
if (w == null)
{
return;
}
try
{
Thread.sleep(1000);
}
catch (InterruptedException e)
{
e.printStackTrace();
}
strokeWeight(4);
long time = w.get_seconds_displacement();
float temp = (float)w.get_temperature();
line(time + 100, 200 - temp, time + 101, 200 - temp);
System.out.println("Drawing: " + time + ", " + temp);
}
}


No comments:
Post a Comment